|
Cytiva Europe
cnbr sepharose 4b  Cnbr Sepharose 4b, supplied by Cytiva Europe, used in various techniques. Bioz Stars score: 96/100, based on 1 PubMed citations. ZERO BIAS - scores, article reviews, protocol conditions and more https://www.bioz.com/product/d+eclipse+c1+si+confocal+microscope/Sepharose+4B/pmc04139222-319-5-10 Average 96 stars, based on 1 article reviews
cnbr sepharose 4b - by Bioz Stars,
2026-10
96/100 stars
|
Buy from Supplier |
|
Cell Signaling Technology Inc
rabbit polyclonal anti lamin a c  Rabbit Polyclonal Anti Lamin A C, supplied by Cell Signaling Technology Inc, used in various techniques. Bioz Stars score: 96/100, based on 1 PubMed citations. ZERO BIAS - scores, article reviews, protocol conditions and more https://www.bioz.com/product/d+eclipse+c1+si+confocal+microscope/Lamin+A%2FC+Antibody/pmc06682159-385-71-76 Average 96 stars, based on 1 article reviews
rabbit polyclonal anti lamin a c - by Bioz Stars,
2026-10
96/100 stars
|
Buy from Supplier |
|
Nikon
plan apo tirf 60x Plan Apo Tirf 60x, supplied by Nikon, used in various techniques. Bioz Stars score: 99/100, based on 1 PubMed citations. ZERO BIAS - scores, article reviews, protocol conditions and more https://www.bioz.com/product/d+eclipse+c1+si+confocal+microscope/Objectives/pmc02794333-75-15-14 Average 99 stars, based on 1 article reviews
plan apo tirf 60x - by Bioz Stars,
2026-10
99/100 stars
|
Buy from Supplier |
|
Nikon
nikon c2 confocal microscope Nikon C2 Confocal Microscope, supplied by Nikon, used in various techniques. Bioz Stars score: 99/100, based on 1 PubMed citations. ZERO BIAS - scores, article reviews, protocol conditions and more https://www.bioz.com/product/d+eclipse+c1+si+confocal+microscope/C2%2B/10__1038_slash_s41428___025___01073___1-70-9-13 Average 99 stars, based on 1 article reviews
nikon c2 confocal microscope - by Bioz Stars,
2026-10
99/100 stars
|
Buy from Supplier |
|
Addgene inc
mouse trim21  Mouse Trim21, supplied by Addgene inc, used in various techniques. Bioz Stars score: 93/100, based on 1 PubMed citations. ZERO BIAS - scores, article reviews, protocol conditions and more https://www.bioz.com/product/d+eclipse+c1+si+confocal+microscope/pmCherry-C1-mTrim21+(Plasmid+%23105516)/bio_rxiv__2020__07__28__225359-267-12-14 Average 93 stars, based on 1 article reviews
mouse trim21 - by Bioz Stars,
2026-10
93/100 stars
|
Buy from Supplier |
|
Qiagen
nickel nitrilotriacetic acid ni nta agarose beads  Nickel Nitrilotriacetic Acid Ni Nta Agarose Beads, supplied by Qiagen, used in various techniques. Bioz Stars score: 99/100, based on 1 PubMed citations. ZERO BIAS - scores, article reviews, protocol conditions and more https://www.bioz.com/product/d+eclipse+c1+si+confocal+microscope/Ni-NTA+Agarose/pmc13106031-529-39-44 Average 99 stars, based on 1 article reviews
nickel nitrilotriacetic acid ni nta agarose beads - by Bioz Stars,
2026-10
99/100 stars
|
Buy from Supplier |
|
Nikon
ti e inverted microscope Ti E Inverted Microscope, supplied by Nikon, used in various techniques. Bioz Stars score: 99/100, based on 1 PubMed citations. ZERO BIAS - scores, article reviews, protocol conditions and more https://www.bioz.com/product/d+eclipse+c1+si+confocal+microscope/Inverted+Microscopes/pmc03507370-287-15-14 Average 99 stars, based on 1 article reviews
ti e inverted microscope - by Bioz Stars,
2026-10
99/100 stars
|
Buy from Supplier |
|
RayBiotech inc
human bone metabolism array ![P7C3 is non‐cytotoxic and promotes hBMSC osteogenesis while inhibiting adipogenesis. A] The MTT assay was performed to determine cell metabolic activity. hBMSCs were treated with 0, 1 or 10 µM of P7C3 for 3 days and 5 days. 1 or 10 µM of DMSO were used as a vehicle control. B] Representative confocal microscopy images of hBMSCs treated with or without 10 µM of P7C3. The cells were fixed, stained with phalloidin (red) and DAPI (blue), and examined using confocal laser scanning microscopy. C] ALP staining results of hBMSCs cultured in osteogenic induction medium supplemented with P7C3 or DMSO vehicle (day 7). Representative ALP‐stained micrographs are shown in the lower panels of each figure. D] Alizarin red S staining for mineral deposition. Mineral deposition appears bright red in color (day 14). E] Quantification of mineralized calcium nodules (day 14). F] Alizarin red S staining results (day 28). Intense mineralized calcium nodule staining was noted following 10 µM P7C3 treatment. G] Quantification of mineralized calcium nodules (day 28). H] Results from a human bone <t>metabolism</t> array and quantification via a heat map. hBMSCs were either treated with 10 µM DMSO or 10 µM P7C3 in osteogenic differentiation media for 21 days. The cells were collected for array analysis. I] A human TGF‐β pathway phosphorylation array and quantification via a heat map. hBMSCs were either treated with 10 µM DMSO or 10 µM P7C3 in osteogenic differentiation media for 1 h. The cells were collected for array analysis. J–L] Representative phase contrast and LipidSpot™ Lipid Droplet‐stained images of hBMSCs cultured in adipogenic induction medium supplemented with P7C3 or the DMSO vehicle for 14 days J] and 21 days L]. The quantification of LipidSpot™ + cells is presented in image K. M] Heat map of mRNA expression levels of adipogenesis‐related genes were measured after 12 days of culture. hBMSCs were cultured in adipogenic induction medium supplemented with either P7C3 or DMSO for 12 days. The gene expression of ADPOQ , SREBP‐1 , CEBPA , FABP4 , and LPL were investigated. * p < 0.05, ** p < 0.01, **** p < 0.0001.](https://pub-med-central-images-cdn.bioz.com/pub_med_central_ids_ending_with_1083/pmc11151083/pmc11151083__ADVS-11-2308698-g001.jpg) Human Bone Metabolism Array, supplied by RayBiotech inc, used in various techniques. Bioz Stars score: 92/100, based on 1 PubMed citations. ZERO BIAS - scores, article reviews, protocol conditions and more https://www.bioz.com/product/d+eclipse+c1+si+confocal+microscope/Human+TGF+beta+Pathway+Phosphorylation+Array+C1/pmc11151083-336-1-6 Average 92 stars, based on 1 article reviews
human bone metabolism array - by Bioz Stars,
2026-10
92/100 stars
|
Buy from Supplier |
|
Jena Bioscience
atp conjugated agarose ![Acetylation <t>of</t> <t>CDK5</t> at K33 causes a loss of kinase activity due to impaired <t>ATP</t> binding. ( a , b ) HEK293 cells were transfected with either FLAG-tagged wild type mouse CDK5 (WT), an acetyl-null mutant (K33R; KR) or a mimetic mutant (K33Q; KQ) of CDK5 in the presence of ( a ) p35-HA or ( b ) p25-HA. Lysates were immunoprecipitated (IPed) with an anti-FLAG antibody and then subjected to an in vitro phosphorylation assay using histone H1 as a substrate. The resulting phosphorylated H1 (P-H1) was visualized via immunoblot analysis (IB) with an anti-phospho-H1 antibody. Coomassie brilliant blue (CBB) staining for H1 was used as a loading control. Immunoprecipitates or whole cell lysates (WCLs) were resolved by SDS-PAGE and subjected to IB with the indicated antibodies. Anti-glyceraldehyde-3-phosphate dehydrogenase (GAPDH) was used as a loading control for WCL. ( c ) Bacterially purified, recombinant His-tagged CDK5 WT or K33-acetylated CDK5 (Ac-CDK5; Ac) was subjected to an in vitro phosphorylation assay in the presence of H1, [γ- 32 P]ATP and the indicated doses of recombinant p25. The resulting phosphorylated H1 was visualized by autoradiography. Inputs were resolved by SDS-PAGE and subjected to IB with the indicated antibodies. ( d ) Recombinant His-CDK5 WT or His-Ac-CDK5 was incubated with or without resin conjugated to ATP. After washing, the resulting ATP-bound CDK5 was resolved by SDS-PAGE and visualized by IB with an anti-His antibody. Input signals were measured by IB with the indicated antibodies. ( e ) Recombinant His-CDK5 WT (blue-filled circles) or His-Ac-CDK5 (magenta-filled rectangles) was titrated with increasing concentration of mant-ATP. Nonlinear regression was performed to obtain a best-fit curve for a specific binding [Y = Bmax*X/(Kd + X)] and the summary of binding parameters were shown in Supplementary Table . X-axis represents the varying concentration of mant-ATP as indicated. Y-axis represents the relative fluorescence intensity of specific binding, where Bmax is maximum specific binding and Kd is equilibrium binding constant. Wilcoxon matched-pairs rank test was employed to test the binding difference between CDK5 WT and Ac-CDK5 ( ** P = 0.004; Spearman correlation coefficient, rs = 0.976; n = 3). ( f ) Lysates from HEK293 cells expressing p35-FLAG or p25-FLAG were incubated with recombinant His-CDK5 WT or His-Ac-CDK5 bound to Ni-NTA beads. Reaction mixtures were subjected to pull-down and subsequent IB with the indicated antibodies. An anti-FLAG antibody was employed to visualize the extent of CDK5-bound p35 or p25. WCLs were subjected to IB with the indicated antibodies. ( g ) Recombinant His-CDK5 WT plus increasing amounts of recombinant His-Ac-CDK5 was subjected to an in vitro phosphorylation assay in the presence of H1 and [γ- 32 P]ATP. Phosphorylated H1 levels were visualized by autoradiography.](https://pub-med-central-images-cdn.bioz.com/pub_med_central_ids_ending_with_5752/pmc06135752/pmc06135752__41598_2018_31785_Fig1_HTML.jpg) Atp Conjugated Agarose, supplied by Jena Bioscience, used in various techniques. Bioz Stars score: 94/100, based on 1 PubMed citations. ZERO BIAS - scores, article reviews, protocol conditions and more https://www.bioz.com/product/d+eclipse+c1+si+confocal+microscope/Agarose/pmc06135752-384-22-24 Average 94 stars, based on 1 article reviews
atp conjugated agarose - by Bioz Stars,
2026-10
94/100 stars
|
Buy from Supplier |
|
Addgene inc
mapple  Mapple, supplied by Addgene inc, used in various techniques. Bioz Stars score: 93/100, based on 1 PubMed citations. ZERO BIAS - scores, article reviews, protocol conditions and more https://www.bioz.com/product/d+eclipse+c1+si+confocal+microscope/mApple-C1+(Plasmid+%2354631)/pmc08500716-197-7-9 Average 93 stars, based on 1 article reviews
mapple - by Bioz Stars,
2026-10
93/100 stars
|
Buy from Supplier |
|
Addgene inc
mito mscarlet dennd6a  Mito Mscarlet Dennd6a, supplied by Addgene inc, used in various techniques. Bioz Stars score: 95/100, based on 1 PubMed citations. ZERO BIAS - scores, article reviews, protocol conditions and more https://www.bioz.com/product/d+eclipse+c1+si+confocal+microscope/pmScarlet-i_C1+(Plasmid+%2385044)/bio_rxiv__2023__08__21__554162-211-9-14 Average 95 stars, based on 1 article reviews
mito mscarlet dennd6a - by Bioz Stars,
2026-10
95/100 stars
|
Buy from Supplier |
|
Genecopoeia
human msc exosome mirna qpcr array  Human Msc Exosome Mirna Qpcr Array, supplied by Genecopoeia, used in various techniques. Bioz Stars score: 94/100, based on 1 PubMed citations. ZERO BIAS - scores, article reviews, protocol conditions and more https://www.bioz.com/product/d+eclipse+c1+si+confocal+microscope/miProfile+Human+MSC+exosome+miRNA+qPCR+array/bio_rxiv__2025__08__12__669872-217-6-12 Average 94 stars, based on 1 article reviews
human msc exosome mirna qpcr array - by Bioz Stars,
2026-10
94/100 stars
|
Buy from Supplier |
Image Search Results
Journal: The Journal of Biological Chemistry
Article Title: Chemical Proteomics Identifies Heterogeneous Nuclear Ribonucleoprotein (hnRNP) A1 as the Molecular Target of Quercetin in Its Anti-cancer Effects in PC-3 Cells
doi: 10.1074/jbc.M114.553248
Figure Lengend Snippet: Schematic depiction of the workflow used to identify and characterize quercetin-binding proteins. Quercetin-specific binding proteins were captured by quercetin-Sepharose beads, and eluted fractions were resolved by SDS-PAGE. Distinct proteins in gel-eluted bands were identified using MS and validated by immunoblotting analyses and surface plasmon resonance binding assays. Specific targets were further characterized using a series of approaches, including confocal microscopy, IP, RIP, RT-qPCR, and immunoblotting analysis. Q, quercetin; T, total cell lysates; W, proteins that did not bind quercetin; E, bound proteins eluted.
Article Snippet: Quercetin was from Sigma-Aldrich, and
Techniques: Binding Assay, SDS Page, Western Blot, SPR Assay, Confocal Microscopy, Quantitative RT-PCR
Journal: PLoS Pathogens
Article Title: SopF, a phosphoinositide binding effector, promotes the stability of the nascent Salmonella -containing vacuole
doi: 10.1371/journal.ppat.1007959
Figure Lengend Snippet: (A) HeLa cells were transfected with a plasmid encoding for EGFP-SopF for 18 h and then subject to confocal fluorescence microscopy or sequential detergent fractionation. Left panel shows a representative confocal microscopy image. EGFP-SopF (greyscale), DNA (blue). Scale bar is 10 μm. Right panel shows immunoblotting analysis. Cells were collected and subject to sequential detergent fractionation. Equal volumes of saponin-soluble, TX-100-soluble, and SDS-soluble fractions were separated by SDS-PAGE and subject to immunoblotting with antibodies against GFP, Hsp27 (cytosol), calnexin (membranes) and lamin A/C (nucleus). Molecular mass markers are indicated on the left. Results are representative of two independent experiments. (B) As for (A) except HeLa cells were transfected with a plasmid encoding for FLAG-SopF. FLAG-SopF was detected by immunostaining (left panel) or immunoblotting (right panel) with anti-FLAG antibodies. (C) SopF partially colocalizes with actin-binding proteins found at cell adhesion sites. HeLa cells were transfected with pFLAG-SopF for 18 h, then fixed and immunostained with anti-FLAG, anti-moesin, anti-lamellipodin and anti-vasodilator-stimulated phosphoprotein (VASP) antibodies. Representative confocal microscopy images show FLAG-SopF in green and moesin, lamellipodin or VASP in red. Scale bars are 10 μm. Insets show enlargements of boxed areas.
Article Snippet: Membranes were blocked at room temperature for 1 h with Tris-buffered saline (TBS) containing 5% (w/v) skim milk powder and 0.1% (v/v) Tween-20 (TBST-milk), then incubated with the following primary antibodies overnight at 4˚C: mouse anti-FLAG M2 affinity isolated (1:2,000 dilution; Sigma), mouse anti-HA.11 ascites (1:2,000; BioLegend), rabbit polyclonal anti-GFP (1:40,000; Thermo), mouse anti-β-lactamase (clone 8A5.A10, 1:2,000 dilution; Thermo), mouse anti-Hsp27 (clone G31, 1:20,000; Cell Signaling), rabbit polyclonal anti-calnexin (1:40,000; Enzo),
Techniques: Transfection, Plasmid Preparation, Fluorescence, Microscopy, Fractionation, Confocal Microscopy, Western Blot, SDS Page, Immunostaining, Binding Assay

Journal: PLoS Pathogens
Article Title: SopF, a phosphoinositide binding effector, promotes the stability of the nascent Salmonella -containing vacuole
doi: 10.1371/journal.ppat.1007959
Figure Lengend Snippet: (A) HeLa epithelial cells were infected with S . Typhimurium wild type (WT), Δ sopF , Δ sopF pSopF (comp), Δ sopF pSopF(1–345), Δ sopF pSopF(1–367) or Δ sopF pACYC177 (empty vector) bacteria. The proportion of cytosolic bacteria was determined by CHQ resistance assay at 90 min p.i. (upper panel) or GAL8 recruitment at 1 h p.i. (lower panel, all bacteria are constitutively expressing mCherry for fluorescence detection). Upper panel: data represent the mean ± SD (n≥3 independent experiments). Lower panel: Data represent the mean ± SD (total of >600 bacteria per strain from n≥3 independent experiments). Asterisks indicate data significantly different from WT infection (one-way ANOVA with Dunnett’s post-hoc test). (B) HeLa cells were transfected with plasmids encoding for FLAG-SopF(1–367) or FLAG-SopF(1–345) for 18 h. Cells were fixed and immunostained with anti-FLAG antibodies. DNA was stained with Hoechst 33342. Representative confocal microscopy images show FLAG-SopF in greyscale and DNA in blue. Scale bars are 10 μm. (C) Subcellular fractionation of transfected cells. HeLa cells were transfected with plasmids encoding for FLAG-SopF, FLAG-SopF(1–367) or FLAG-SopF(1–345) for 18 h, then collected and subjected to sequential detergent fractionation. Equal volumes of saponin-soluble, TX-100-soluble, and SDS-soluble fractions were separated by SDS-PAGE and subject to immunoblotting with antibodies against the FLAG epitope, Hsp27 (cytosol), calnexin (membranes) and lamin A/C (nucleus). Molecular mass markers are indicated on the left. Results are representative of two independent experiments. (D) C-terminal truncations of SopF lose plasma membrane association in the S . cerevisiae mss4 tet-off strain. Wild type (WT) and mss4 tet-off yeast strains were transformed with plasmids encoding for yEGFP-SopF, yEGFP-SopF C370S, yEGFP-SopF(1–367) or yEGFP-SopF(1–345) and the subcellular localization of SopF in live cells was visualized by widefield fluorescence microscopy. Representative fluorescence images are shown. Scale bars are 2 μm. The role of a potential lipidation site in SopF localization was assessed by site-directed mutagenesis of the Cys370 residue (C370S). The grey box depicts a domain of unknown function (DUF), DUF3626, spanning amino acid residues 178–338 of SopF. (E) Quantification of SopF localization in WT and mss4 tet-off yeast strains that were transformed and visualized as described in (D). Subcellular localization was categorized as cytosol, internal membrane sites (IMS), plasma membrane (PM), or IMS and PM. Results are expressed as the mean percentage of total yeast transformants (n = 300 cells from three independent transformations).
Article Snippet: Membranes were blocked at room temperature for 1 h with Tris-buffered saline (TBS) containing 5% (w/v) skim milk powder and 0.1% (v/v) Tween-20 (TBST-milk), then incubated with the following primary antibodies overnight at 4˚C: mouse anti-FLAG M2 affinity isolated (1:2,000 dilution; Sigma), mouse anti-HA.11 ascites (1:2,000; BioLegend), rabbit polyclonal anti-GFP (1:40,000; Thermo), mouse anti-β-lactamase (clone 8A5.A10, 1:2,000 dilution; Thermo), mouse anti-Hsp27 (clone G31, 1:20,000; Cell Signaling), rabbit polyclonal anti-calnexin (1:40,000; Enzo),
Techniques: Infection, Plasmid Preparation, Expressing, Fluorescence, Transfection, Staining, Confocal Microscopy, Fractionation, SDS Page, Western Blot, FLAG-tag, Transformation Assay, Microscopy, Mutagenesis
Journal: bioRxiv
Article Title: Substrate-induced clustering activates Trim-Away of pathogens and proteins
doi: 10.1101/2020.07.28.225359
Figure Lengend Snippet: (A and C) HEK293T cells stably expressing the indicated TRIM21 mutants (EV = empty vector) were transfected with WT His-ubiquitin and infected with AdV5 ± 9C12 or 9C12(H433A). Ubiquitinated proteins were isolated by denaturing His-pulldown using Ni-NTA beads in 6M Guanidine buffer before immunoblot analysis with anti-TRIM21 antibody. (B) A co-crystal structure of TRIM21 RING:Ube2N∼ubiquitin complex (PDB: 6S53) showing the tri-anionic anchor motif (E12, E13 and D21) and second site residues (R67 and N71). (D) Immunoblot of TRIM21 following denaturing His-ubiquitin pulldown from HEK293T cells overexpressing the indicated ubiquitin mutant at 30 min post infection with AdV5 ± 9C12 or 9C12(H433A). See also
Article Snippet: To generate optogenetic constructs for S2 cell expression, vhhGFP4 , mRFP ,
Techniques: Stable Transfection, Expressing, Plasmid Preparation, Transfection, Ubiquitin Proteomics, Infection, Isolation, Western Blot, Mutagenesis

Journal: bioRxiv
Article Title: Substrate-induced clustering activates Trim-Away of pathogens and proteins
doi: 10.1101/2020.07.28.225359
Figure Lengend Snippet: Denaturing TRIM21-His pulldown from HEK293T cells stably expressing TRIM21-His and infected with AdV5 ± 9C12 or 9C12(H433A) which does not bind TRIM21. Cells were lysed in buffer containing 4M urea and where indicated, the Nickel beads were treated with the deubiquitinase USP2 before boiling and immunoblotting with anti-TRIM21 antibody.
Article Snippet: To generate optogenetic constructs for S2 cell expression, vhhGFP4 , mRFP ,
Techniques: Stable Transfection, Expressing, Infection, Western Blot

Journal: bioRxiv
Article Title: Substrate-induced clustering activates Trim-Away of pathogens and proteins
doi: 10.1101/2020.07.28.225359
Figure Lengend Snippet: (A) Sequence of TRIM21 with RING domain in gray, B Box in red, coiled-coil in cyan, L2 linker helices in orange & green and PRYSPRY in magenta. (B) SEC-MALS chromatograms of TRIM21 CC (129-235) loaded at concentrations of 15 (black), 5 (green), 0.55 (blue) and 0.25 mg/ml (red) are shown, in which the refractive index is indicated by the solid lines while the molar mass evaluated from the light scattering analysis is indicated with the corresponding coloured dotted lines. (C) Using a MicroCal iTC200 calorimeter, 140 µM TRIM21 coiled-coil was added in 2 µl injections into buffer at 25 °C. Integrated heats were then fit to a dimer dissociation model reveal an enthalpy of 65 kcal/mol and Kd of 7 µM. (D-F) SAXS data on TRIM21 constructs. (D) SAXS data were collected at the beam line P12 of the EMBL at the Petra-III storage ring (DESY, Hamburg). Protein expression, purification, data analysis and collection are in Supplementary Information. Data statistics are shown in Table 1. (D) Concentration-normalised scattering plots and DAM fits for CC235 (cyan, χ = 1.00), MBP-CC235 (green, χ = 1.31) and RBCC (purple, χ = 1.05). (E) The linear Guinier regions from (D). (F) Derived P( r ) curves. The CC235 P( r ) curve is consistent with an elongated rod, while the two peaks observed for MBP-CC235 and RBCC are consistent with ‘dumbbell’-shaped molecules. (G-I). SAXS data on TRIM21:Fc complex. (G) Scattering plot with DAM fit (red line, 1.00), TRIM21:Fc atomic model fit (blue, χ = 1.04), and apo-TRIM21 atomic model fit (brown dashed, χ = 2.00). (H) The linear Guinier regions from (G). (I) Derived P( r ) curves.
Article Snippet: To generate optogenetic constructs for S2 cell expression, vhhGFP4 , mRFP ,
Techniques: Sequencing, Refractive Index, Construct, Expressing, Purification, Concentration Assay, Derivative Assay

Journal: bioRxiv
Article Title: Substrate-induced clustering activates Trim-Away of pathogens and proteins
doi: 10.1101/2020.07.28.225359
Figure Lengend Snippet: (A) Dummy atom model (DAM) structures of TRIM21 calculated from SAXS data shown in . Overlay of reconstructions of constructs comprising TRIM21 residues 1-235 (RBCC, purple spheres) and TRIM21 residues 129-235 (CC235, blue spheres). A structural model of the TRIM21 RBCC region based on atomic models of the TRIM21 RING (yellow) and B Box (orange) domains and TRIM25 coiled-coil domain (cyan) using PDBs 5OLM and 4CFG respectively. (B) SAXS-derived model of TRIM21:Fc complex. Averaged and filtered DAM’s (white and green spheres, respectively) overlaid with an atomic model of the TRIM21:Fc complex. The RING, B Box and coiled-coil regions are as above. The PRYSPRY (magenta) and IgG Fc (grey) domains are taken directly from PDB 2IWG. (C) Crystal structure of TRIM21 RING dimer showing the important residues M10 and M72 at the dimer interface. (D) Immunoblot of TRIM21 following denaturing His-ubiquitin pulldown from TRIM21 lentivector reconstituted HEK293T cells overexpressing WT His-ubiquitin at 30 min post infection with AdV5 ± 9C12 or 9C12(H433A). (E) Trim-away of IKKα in TRIM21 lentivector reconstituted HEK293T cell lines by electroporation of anti-IKKα IgG (anti-IKKα). Cell lysates were immunoblotted for the indicated proteins. (F) in vitro ubiquitination assay using the indicated TRIM21 constructs and Ube2N. Samples were taken at the indicated timepoints and analysed by immunoblotting with anti-ubiquitin antibody. (G) Immunoblot analysis of ubiquitin discharge from Ube2N by the indicated TRIM21 constructs over a course of 20 minutes. (H) Quantification of the Ube2N∼Ub band in G relative to time point 0 in each reaction. See also
Article Snippet: To generate optogenetic constructs for S2 cell expression, vhhGFP4 , mRFP ,
Techniques: Construct, Derivative Assay, Western Blot, Ubiquitin Proteomics, Infection, Electroporation, In Vitro

Journal: bioRxiv
Article Title: Substrate-induced clustering activates Trim-Away of pathogens and proteins
doi: 10.1101/2020.07.28.225359
Figure Lengend Snippet: (A) Schematic illustration of multimeric TRIM21 assembly on the surface of a virus-antibody complex. (B) Remaining infectivity of AdV5-GFP particles on HEK293T cells following incubation with saturating concentrations of 9C12. For 1/e neutralization, approximately 12% of antibodies must bear an intact TRIM21 binding site which is present on 9C12(WT) but lacking in 9C12(H433A). This equates to 24 out of the maximum ∼200 antibodies bound to AdV5 at saturation. (C, E, J and L) Neutralisation of AdV5 by 9C12 in lentivector reconstituted HEK293T cells expressing the indicated TRIM21 mutants. Data normalised to the virus only condition and presented as the mean ± SEM. (D and F) AdV5-9C12 immune complex-induced NF-kB activation in HEK293T cells stably expressing the indicated TRIM21 mutants. Data normalised to the virus only condition and presented as the mean ± SEM. (G) In vitro ubiquitination assay using the indicated TRIM21 RING-linker-RING (RLR) constructs and Ube2N. Samples were taken at the indicated timepoints and analysed by immunoblotting with anti-ubiquitin antibody. (H) Trim-away of IKKα in TRIM21 lentivector reconstituted HEK293T cell lines by electroporation of anti-IKKα IgG (anti-IKKα). Cell lysates were immunoblotted for the indicated proteins. (I) Crystal structure of TRIM21-RING-B-box (PDB: 5OLM) showing residue S80 at situated at the RING:B Box interface. (K) Structure of the hydrophobic core at the TRIM21 RING:Ube2N interface (PDB: 6S53). See also Figures S3 and S4
Article Snippet: To generate optogenetic constructs for S2 cell expression, vhhGFP4 , mRFP ,
Techniques: Virus, Infection, Incubation, Neutralization, Binding Assay, Expressing, Activation Assay, Stable Transfection, In Vitro, Ubiquitin Proteomics, Construct, Western Blot, Electroporation, Residue

Journal: bioRxiv
Article Title: Substrate-induced clustering activates Trim-Away of pathogens and proteins
doi: 10.1101/2020.07.28.225359
Figure Lengend Snippet: (A) Upper panel: TRIM5α (rhesus) residues involved in mediating the three layers of box-box interactions (PDB:5EIA). Lower panel: model of TRIM21 B box domain structure (PDB:5OLM) onto the trimeric box structure of TRIM5α (PDB:5EIA). Residues that could mediate B box: B box interactions are highlighted. (B and C) Neutralisation of AdV5 by 9C12 in lentivector-reconstituted HEK293T cells expressing the indicated TRIM21 mutants. Data normalised to the virus only condition and presented as the mean ± SEM. (D) AdV5-9C12 immune complex-induced NF-kB activation in HEK293T cells stably expressing the indicated TRIM21 mutants. Data normalised to the virus only condition and presented as the mean ± SD. (E) Neutralisation of AdV5 by 9C12 in HEK293T cells stably expressing TRIM21-ΔBox construct with or without MG132 (20 µM). Data normalised to the virus only condition and presented as the mean ± SD.
Article Snippet: To generate optogenetic constructs for S2 cell expression, vhhGFP4 , mRFP ,
Techniques: Expressing, Virus, Activation Assay, Stable Transfection, Construct

Journal: bioRxiv
Article Title: Substrate-induced clustering activates Trim-Away of pathogens and proteins
doi: 10.1101/2020.07.28.225359
Figure Lengend Snippet: (A) Schematic of myc-mEGFP constructs. (B-D) HEK293T-mCherry-TRIM21 cells were electroporated with mRNA encoding the indicated myc-mEGFP constructs together with either control IgG (9C12), ant-Myc (9E10) or anti-GFP (polyclonal) antibodies. 8 hours post-electroporation cellular GFP fluorescence was imaged (B) and quantified (C) using the IncuCyte system, or total GFP protein levels analysed by immunoblotting (D) cell extracts with the indicated antibodies. Scale bar 100 µm. (E) HEK293T-mCherry-TRIM21 cells were electroporated with mRNA encoding the indicated myc-mEGFP constructs together with control IgG or increasing concentrations of anti-Myc antibody and GFP fluorescence quantified 8 hours later. (F) HEK293T-mCherry-TRIM21 cells were electroporated with mRNA encoding 2myc-mEGFP together with the indicated antibodies and GFP fluorescence quantified 8 hours later. (G-I) The indicated antibodies (50 nM) either alone, or mixed with GFP protein (100 nM), were analysed by mass photometry. (J) RPE-1 cells expressing mEGFP were electroporated with the indicated antibodies and cell extracts blotted 3 hours later for the indicated proteins. See also
Article Snippet: To generate optogenetic constructs for S2 cell expression, vhhGFP4 , mRFP ,
Techniques: Construct, Control, Electroporation, Fluorescence, Western Blot, Expressing

Journal: bioRxiv
Article Title: Substrate-induced clustering activates Trim-Away of pathogens and proteins
doi: 10.1101/2020.07.28.225359
Figure Lengend Snippet: RPE-1 TRIM21 KO cells expressing membrane-localised GFP (mem-mEGFP) were electroporated with PBS, control IgG or the indicated anti-GFP antibodies. Cells were fixed 3 hours post-electroporation and stained with alexa 647-conjugated anti-IgG secondary antibodies and imaged by confocal microscopy. Scale bar 10 µm.
Article Snippet: To generate optogenetic constructs for S2 cell expression, vhhGFP4 , mRFP ,
Techniques: Expressing, Membrane, Control, Electroporation, Staining, Confocal Microscopy

Journal: bioRxiv
Article Title: Substrate-induced clustering activates Trim-Away of pathogens and proteins
doi: 10.1101/2020.07.28.225359
Figure Lengend Snippet: (A) Schematic of light-induced clustering of TRIM21. (B-C) Drosophila S2 cells expressing the indicated constructs were incubated with or without MG132 and RFP fluorescence quantified by live imaging. Time shows minutes (min) from onset of blue light exposure. Scale bar 5 µm. Pseudo-coloured kymographs show fluorescence intensity in regions defined by red dotted lines. Graph shows mean fluorescence intensity (± SD) of RFP-CRY2-TRIM21 (n = 23) and RFP-CRY2-TRIM21+MG132 (n = 20) normalised for the respective controls (RFP-CRY2 (n=16) and RFP-CRY2 + MG132 (n=15)). (D-G) RPE-1 cells expressing the indicated constructs together with mem-mEGFP were incubated with or without MG132 and blue light for 3 hours prior to immunoblotting for the indicated proteins. See also Movie S2
Article Snippet: To generate optogenetic constructs for S2 cell expression, vhhGFP4 , mRFP ,
Techniques: Expressing, Construct, Incubation, Fluorescence, Imaging, Western Blot

Journal: bioRxiv
Article Title: Substrate-induced clustering activates Trim-Away of pathogens and proteins
doi: 10.1101/2020.07.28.225359
Figure Lengend Snippet: (A) Catalysis of unanchored ubiquitin chains by TRIM21 RING (R), RING-Box (RB), RING-Box-Coiled-Coil (RBCC) and full length MBP-tagged TRIM21 (FL-hT21). (B-C) Catalysis of ubiquitin discharge from ubiquitin-conjugated Ube2N by RING (R), RING Box (RB), RING Box coiled-coiled (RBCC) and full length MBP-tagged TRIM21 (FL-hT21).
Article Snippet: To generate optogenetic constructs for S2 cell expression, vhhGFP4 , mRFP ,
Techniques: Ubiquitin Proteomics

Journal: bioRxiv
Article Title: Substrate-induced clustering activates Trim-Away of pathogens and proteins
doi: 10.1101/2020.07.28.225359
Figure Lengend Snippet: (A) Schematic of TRIM21, nanobody-Fc and TRIM21-nanobody chimeric constructs. (B) NIH3T3-Caveolin-1-GFP cells were electroporated with mRNA encoding the indicated constructs. 16 hours later cell extracts were immunoblotted for the indicated proteins. (C-D) NIH3T3-Caveolin-1-GFP and (F-G) RPE-1H2B-mEGFP-FKBP cells were electroporated with water (control) or mRNAs encoding the indicated TRIM21-nanobody chimeric constructs and GFP fluorescence was imaged (C and F) and quantified (D and G) using the IncuCyte system. Time shows hours:minutes (h:min) post-electroporation. Scale bar 50 µm (C) and 30 µm (F). (E) NIH3T3-Caveolin-1-GFP cells and (H) RPE-1-H2B-mEGFP-FKBP cells were electroporated with mRNA encoding mCherry-tagged versions of the indicated constructs and GFP and mCherry fluorescence quantified using the IncuCyte system. TRIM21-nanobody chimera expression levels (mCherry fluorescence) are plotted against GFP fluorescence. See also and Movie S2.
Article Snippet: To generate optogenetic constructs for S2 cell expression, vhhGFP4 , mRFP ,
Techniques: Construct, Control, Fluorescence, Electroporation, Expressing

Journal: bioRxiv
Article Title: Substrate-induced clustering activates Trim-Away of pathogens and proteins
doi: 10.1101/2020.07.28.225359
Figure Lengend Snippet: (A-D) NIH3T3-Caveolin-1-GFP (A and B) and RPE-1-H2B-mEGFP-FKBP (C and D) cells were electroporated with mRNA encoding mCherry-T21R-vhhGFP4, incubated with either DMSO (control) or MG132 and imaged (A and C) and GFP fluorescence quantified (B and D) with the IncuCyte system. Scale bar 20 µm. (E and F) NIH3T3 cells (E) and RPE-1 cells (F) were electroporated with mRNA encoding mCherry-tagged versions of the indicated TRIM21-nanobody constructs and mCherry fluorescence quantified using the IncuCyte system. (G and H) NIH3T3-Caveolin-1-GFP cells were electroporated with the indicated concentrations of T21R-vhhGFP4 (G) or T21RB-vhhGFP4 (H) proteins and GFP fluorescence quantified with the IncuCyte system. (I) Data from G and H plotted as protein concentration against GFP fluorescence at 4 hours post-electroporation.
Article Snippet: To generate optogenetic constructs for S2 cell expression, vhhGFP4 , mRFP ,
Techniques: Incubation, Control, Fluorescence, Construct, Protein Concentration, Electroporation

Journal: bioRxiv
Article Title: Substrate-induced clustering activates Trim-Away of pathogens and proteins
doi: 10.1101/2020.07.28.225359
Figure Lengend Snippet: (A) Bacterially-expressed 6His-T21R-vhhGFP4 was purified using a two-step protocol of NiNTA-followed by size exclusion-chromatography and analysed by Coomassie blue staining of SDS-PAGE. (B) NIH3T3-Caveolin-1-GFP cells were electroporated with PBS (control) or the indicated concentrations of T21R-vhhGFP4 protein and GFP fluorescence was quantified using the IncuCyte system. (C) H2B-GFP primary MEFs were electroporated with PBS (control) or T21R-vhhGFP4 in the form or mRNA or protein and GFP fluorescence quantified using the IncuCyte system. Time shows hours (h) post-electroporation. (D-G) Drosophila S2 cells expressing GFP-aPKC and (D, E) vhhGFP4-RFP-CRY2-TRIM21 or (F, G) a LARIAT module that includes RFP-CRY2 fused with vhhGFP4 and which enables clustering in the absence of TRIM21. (E, G) Graphs show mean ± SD fluorescence intensity quantified by live imaging (n = 30 in E and n=24 in G). Time shows minutes (min) from onset of blue light exposure. Scale bar 10 µm.
Article Snippet: To generate optogenetic constructs for S2 cell expression, vhhGFP4 , mRFP ,
Techniques: Purification, Size-exclusion Chromatography, Staining, SDS Page, Control, Fluorescence, Electroporation, Expressing, Imaging
Journal: Nature Plants
Article Title: De-repression of protein phosphatase 5 by the chaperone organizer HOP1 activates plant NLR immunity
doi: 10.1038/s41477-026-02253-4
Figure Lengend Snippet: a , LET7 PPase does not interact with TPR5G. Recombinant HIS-LET7 PPase proteins purified from E. coli were immobilized on Ni-NTA biosensor chips and incubated with soluble GST-LET7 TPR , GST-TPR5G, or GST proteins as analyte. The buffer served as a control (Ctrl). The graph shows the association (0 to 180 sec) and dissociation (180 to 360 sec) times of the interaction (left). CBB staining shows the recombinant protein expression (right). b , AlphaFold-based prediction of LET7 and its crystal structure. Structural models generated with AlphaFold 2 of full-length LET7 (left panel). The AlphaFold-predicted structure of LET7 is reminiscent of its crystal structure with the intramolecular interaction between LET7 TPR and LET7 PPase . X-ray crystal structure of LET7 showing autoinhibition of the catalytic LET7 PPase domain (green) by binding to the N-terminal TPR domain (blue) (PDB code: 7OBE) (right panel). LET7 structure figures were prepared in PyMOL (The PyMOL Molecular Graphics System, Version 2.0, DeLano Scientific, Palo Alto, CA, 1998, https://pymol.org/2/ ). c , Potential LET7-interacting proteins identified by Y2H screens. LET7 in the pGBKT7 vector was transformed into the yeast AH109 strain. The resulting yeast transformants were then transformed with the Arabidopsis cDNA library in the pGADT7 vector, followed by screening using SD-HLT medium supplemented with 1 mM 3-AT. In-frame candidates with the number of independent colonies (count) carrying the corresponding genes are shown. d , Genotyping PCR of three hop1 mutant alleles. Genomic DNAs from WT, hop1-1 ( sail_734_f01 ), hop1-2 ( gabi_420a10 ), and hop1-3 ( salk_052232 ) were used for PCR analysis to check the annotated T-DNA insertions. The primer pair of LP and RP is used to amplify the genomic DNA fragment of HOP1 , and the primer pair of LB and RP is used to amplify the T-DNA insertions. WT seedlings were used as a negative control. e , Genotyping PCR confirms the mekk1 hop1-2 double mutant. Genomic DNAs from the F 2 generation seedlings of the heterozygous mekk1 + /- mutant crossed with hop1-2 were screened by PCR. The primer pair of LP and RP amplifies the genomic DNA fragment of HOP1 or MEKK1 , and the primer pair of LB and RP amplifies the T-DNA insertions. WT seedlings were used as a negative control. f , The rar1 mutant does not obviously suppress RNAi- MEKK1 or RNAi- BAK1/SERK4- mediated cell death. VIGS assays were performed as in Fig. using rar1-21 . Photographs were taken three weeks after inoculation. Scale bar, 1 cm. g , HOP1 TPR1 interacts with LET7 TPR in Y2H assays. Full-length or truncated versions of HOP1 and LET7 were cloned into pGBKT7 and pGADT7 vectors for Y2H assays. Experiments were performed similarly to those in Fig. . Experiments ( a , d-g ) were repeated three times with similar results.
Article Snippet: Genes cloned in recombinant protein expression vectors were induced and expressed in E. coli BL21 strain (DE3) at 16 °C using LB medium supplemented with 0.4 mM isopropyl-β- D -1-thiogalactopyranoside for 12–18 h. HIS fusion proteins were purified using
Techniques: Recombinant, Purification, Incubation, Control, Staining, Expressing, Generated, Binding Assay, Plasmid Preparation, Transformation Assay, cDNA Library Assay, Mutagenesis, Negative Control, Clone Assay

Journal: Nature Plants
Article Title: De-repression of protein phosphatase 5 by the chaperone organizer HOP1 activates plant NLR immunity
doi: 10.1038/s41477-026-02253-4
Figure Lengend Snippet: a , Schematic diagram of mutant lines and protein motifs of HOP1. Top: T-DNA insertions in HOP1 (AT1G12270) for three mutant lines are shown with three T-DNA insertional lines. The open boxes are 5′ and 3′ UTRs, the grey boxes indicate exon protein-coding regions and the lines indicate introns. Bottom: protein motifs, including TPR1, TPR2a and TPR2b, with amino acid positions, are labelled. b – d , The hop1 mutants suppress RNAi -MEKK1 -triggered growth defects, cell death, H 2 O 2 production and PR1 gene expression. WT and hop1 plants are shown three weeks after inoculation with Agrobacterium carrying the VIGS vector targeting GFP as a control (Ctrl) or RNAi -MEKK1 ( b ). Scale bars, 1 cm. Detached leaves were stained with trypan blue for cell death or DAB for H 2 O 2 accumulation ( c ). Scale bars, 0.5 cm. The expression of PR1 was normalized to that of ACTIN2 , and the data are shown as means ± s.d. ( n = 3, biologically independent samples) ( d ). Column 1 versus Column 2, P < 0.0001, Column 1 versus Column 3, P > 0.9999, Column 3 versus Column 4, P = 0.0222. e , f , The hop1-2 mutant suppresses growth defects, cell death and the elevated expression of PR1 and PR2 in mekk1 . Three-week-old soil-grown plants are shown ( e , top) with leaves stained by trypan blue for cell death ( e , bottom). Scale bars, 1 cm. The expression of PR1 and PR2 was normalized to ACTIN2 . PR1 : Column 1 versus Column 3, P < 0.0001, Column 3 versus Column 4, P < 0.0001, Column 2 versus Column 4, P = 0.0003; PR2 : Column 1 versus Column 3, P < 0.0001, Column 3 versus Column 4, P < 0.0001, Column 2 versus Column 4, P = 0.0012. g , h , Expression of HOP1–GFP restores RNAi- MEKK1 -induced growth defects and PR1 expression in hop1-2 . HOP1 tagged with GFP under the 35S promoter ( p35S :: HOP1-GFP ) was transformed into hop1-2 . Scale bars, 1 cm ( g , top). Immunoblotting by an anti-GFP antibody shows HOP1–GFP proteins with CBB staining RBC as a loading control ( g , bottom). The expression of PR1 was normalized to ACTIN2 ( h ). Column 1 versus Column 2, P > 0.9999, Column 1 versus Column 3, P > 0.9999, Column 1 versus Column 5, P < 0.0001, Column 2 versus Column 3, P > 0.9999, Column 2 versus Column 4, P > 0.9999, Column 5 versus Column 6, P < 0.0001, Column 6 versus Column 7, P < 0.0001, Column 6 versus Column 8, P < 0.0001. i , LET7 interacts with HOP1 in Y2H assays. The experiments were performed similarly to those in Fig. . j , LET7 associates with HOP1 in BiFC assays. LET7 or HOP1 was fused with the N-terminal or C-terminal half of YFP (LET7–nYFP, LET7–cYFP, HOP1–cYFP or HOP1–nYFP) and co-expressed in N. benthamiana leaves with empty vectors carrying nYFP or cYFP (EV–nYFP or EV–cYFP) as controls. Signals were observed via confocal microscopy at 48 h post-inoculation. Scale bars, 25 μm. k , LET7 associates with HOP1 in Co-IP assays. LET7–HA was co-expressed with HOP1–GFP or GFP in protoplasts. Total proteins were immunoprecipitated with anti-HA affinity beads, followed by immunoblotting with an anti-GFP or anti-HA antibody (top two panels). Proteins before immunoprecipitation were immunoblotted and are shown as input controls (bottom two panels). l , LET7 interacts with HOP1 in pull-down assays. GST or GST–HOP1 immobilized on glutathione agarose was incubated with HIS–LET7 proteins. Top: washed beads were pelleted for immunoblotting using an anti-HIS antibody. Middle and bottom: input proteins are shown with immunoblotting before pull-down. m , LET7 interacts with HOP1 in BLI assays. Recombinant HIS–LET7 proteins were immobilized on Ni-NTA biosensor chips and incubated over a range of concentrations (1.25–10 μM) of soluble GST–HOP1 proteins as the analyte. The plot shows the association (0 to 180 s) and dissociation (180 to 360 s) times of the interaction. The equilibrium K d of the LET7 and HOP1 interaction is 2.062 ± 0.031 μM as determined by Octet BLI analysis software. The data are shown as mean ± s.d. ( n = 3 biologically independent samples in d , f and h ). Different letters indicate significant differences determined by one-way analysis of variance followed by Tukey’s test ( P < 0.05). The experiments were repeated four times in b , e , i , l and m and three times in c , d , f – h , j and k with similar results.
Article Snippet: Genes cloned in recombinant protein expression vectors were induced and expressed in E. coli BL21 strain (DE3) at 16 °C using LB medium supplemented with 0.4 mM isopropyl-β- D -1-thiogalactopyranoside for 12–18 h. HIS fusion proteins were purified using
Techniques: Mutagenesis, Gene Expression, Plasmid Preparation, Control, Staining, Expressing, Transformation Assay, Western Blot, Confocal Microscopy, Co-Immunoprecipitation Assay, Immunoprecipitation, Incubation, Recombinant, Software
Journal: Advanced Science
Article Title: A Multifunctional Therapeutic Strategy Using P7C3 as A Countermeasure Against Bone Loss and Fragility in An Ovariectomized Rat Model of Postmenopausal Osteoporosis
doi: 10.1002/advs.202308698
Figure Lengend Snippet: P7C3 is non‐cytotoxic and promotes hBMSC osteogenesis while inhibiting adipogenesis. A] The MTT assay was performed to determine cell metabolic activity. hBMSCs were treated with 0, 1 or 10 µM of P7C3 for 3 days and 5 days. 1 or 10 µM of DMSO were used as a vehicle control. B] Representative confocal microscopy images of hBMSCs treated with or without 10 µM of P7C3. The cells were fixed, stained with phalloidin (red) and DAPI (blue), and examined using confocal laser scanning microscopy. C] ALP staining results of hBMSCs cultured in osteogenic induction medium supplemented with P7C3 or DMSO vehicle (day 7). Representative ALP‐stained micrographs are shown in the lower panels of each figure. D] Alizarin red S staining for mineral deposition. Mineral deposition appears bright red in color (day 14). E] Quantification of mineralized calcium nodules (day 14). F] Alizarin red S staining results (day 28). Intense mineralized calcium nodule staining was noted following 10 µM P7C3 treatment. G] Quantification of mineralized calcium nodules (day 28). H] Results from a human bone metabolism array and quantification via a heat map. hBMSCs were either treated with 10 µM DMSO or 10 µM P7C3 in osteogenic differentiation media for 21 days. The cells were collected for array analysis. I] A human TGF‐β pathway phosphorylation array and quantification via a heat map. hBMSCs were either treated with 10 µM DMSO or 10 µM P7C3 in osteogenic differentiation media for 1 h. The cells were collected for array analysis. J–L] Representative phase contrast and LipidSpot™ Lipid Droplet‐stained images of hBMSCs cultured in adipogenic induction medium supplemented with P7C3 or the DMSO vehicle for 14 days J] and 21 days L]. The quantification of LipidSpot™ + cells is presented in image K. M] Heat map of mRNA expression levels of adipogenesis‐related genes were measured after 12 days of culture. hBMSCs were cultured in adipogenic induction medium supplemented with either P7C3 or DMSO for 12 days. The gene expression of ADPOQ , SREBP‐1 , CEBPA , FABP4 , and LPL were investigated. * p < 0.05, ** p < 0.01, **** p < 0.0001.
Article Snippet: The
Techniques: MTT Assay, Activity Assay, Control, Confocal Microscopy, Staining, Confocal Laser Scanning Microscopy, Cell Culture, Phospho-proteomics, Expressing, Gene Expression
Journal: Scientific Reports
Article Title: The acetylation of cyclin-dependent kinase 5 at lysine 33 regulates kinase activity and neurite length in hippocampal neurons
doi: 10.1038/s41598-018-31785-9
Figure Lengend Snippet: Acetylation of CDK5 at K33 causes a loss of kinase activity due to impaired ATP binding. ( a , b ) HEK293 cells were transfected with either FLAG-tagged wild type mouse CDK5 (WT), an acetyl-null mutant (K33R; KR) or a mimetic mutant (K33Q; KQ) of CDK5 in the presence of ( a ) p35-HA or ( b ) p25-HA. Lysates were immunoprecipitated (IPed) with an anti-FLAG antibody and then subjected to an in vitro phosphorylation assay using histone H1 as a substrate. The resulting phosphorylated H1 (P-H1) was visualized via immunoblot analysis (IB) with an anti-phospho-H1 antibody. Coomassie brilliant blue (CBB) staining for H1 was used as a loading control. Immunoprecipitates or whole cell lysates (WCLs) were resolved by SDS-PAGE and subjected to IB with the indicated antibodies. Anti-glyceraldehyde-3-phosphate dehydrogenase (GAPDH) was used as a loading control for WCL. ( c ) Bacterially purified, recombinant His-tagged CDK5 WT or K33-acetylated CDK5 (Ac-CDK5; Ac) was subjected to an in vitro phosphorylation assay in the presence of H1, [γ- 32 P]ATP and the indicated doses of recombinant p25. The resulting phosphorylated H1 was visualized by autoradiography. Inputs were resolved by SDS-PAGE and subjected to IB with the indicated antibodies. ( d ) Recombinant His-CDK5 WT or His-Ac-CDK5 was incubated with or without resin conjugated to ATP. After washing, the resulting ATP-bound CDK5 was resolved by SDS-PAGE and visualized by IB with an anti-His antibody. Input signals were measured by IB with the indicated antibodies. ( e ) Recombinant His-CDK5 WT (blue-filled circles) or His-Ac-CDK5 (magenta-filled rectangles) was titrated with increasing concentration of mant-ATP. Nonlinear regression was performed to obtain a best-fit curve for a specific binding [Y = Bmax*X/(Kd + X)] and the summary of binding parameters were shown in Supplementary Table . X-axis represents the varying concentration of mant-ATP as indicated. Y-axis represents the relative fluorescence intensity of specific binding, where Bmax is maximum specific binding and Kd is equilibrium binding constant. Wilcoxon matched-pairs rank test was employed to test the binding difference between CDK5 WT and Ac-CDK5 ( ** P = 0.004; Spearman correlation coefficient, rs = 0.976; n = 3). ( f ) Lysates from HEK293 cells expressing p35-FLAG or p25-FLAG were incubated with recombinant His-CDK5 WT or His-Ac-CDK5 bound to Ni-NTA beads. Reaction mixtures were subjected to pull-down and subsequent IB with the indicated antibodies. An anti-FLAG antibody was employed to visualize the extent of CDK5-bound p35 or p25. WCLs were subjected to IB with the indicated antibodies. ( g ) Recombinant His-CDK5 WT plus increasing amounts of recombinant His-Ac-CDK5 was subjected to an in vitro phosphorylation assay in the presence of H1 and [γ- 32 P]ATP. Phosphorylated H1 levels were visualized by autoradiography.
Article Snippet: To assess ATP binding affinity, purified recombinant His-CDK5 WT and His-Ac-CDK5 (1 μg) were reacted for 2 hrs with 20 μl of
Techniques: Activity Assay, Binding Assay, Transfection, Mutagenesis, Immunoprecipitation, In Vitro, Phosphorylation Assay, Western Blot, Staining, SDS Page, Purification, Recombinant, Autoradiography, Incubation, Concentration Assay, Fluorescence, Expressing
![GCN5 acetylates CDK5 at K33 in the nucleus. ( a ) Lysates obtained from HEK293 cells expressing FLAG-CDK5 plus one of the indicated KAT vectors were subjected to IP with an anti-FLAG antibody followed by IB with an anti-Ac-CDK5 antibody or anti-FLAG antibody. The intensity of the Ac-CDK5 band was measured using Image-J software and normalized to FLAG-CDK5. The fold change over the control (value = 1) is indicated at the bottom of the blot. WCLs were subjected to IB analysis with the indicated antibodies. Each KAT band is marked by the indicated letters. The asterisk indicates non-specific bands. After normalization to FLAG-CDK5, the fold intensity of Ac-CDK5 versus the control (value = 1) was indicated. The bar represents the mean ± S.D from three independent experiments. *** p < 0.001; * p < 0.05; n.s, not significant. ( b ) Lysates harvested from HEK293 cells expressing FLAG-CDK5 alone or in combination with p35-MYC and/or FLAG-GCN5 were subjected to IP with an anti-FLAG antibody. The bound CDK5 was incubated in the presence of H1 and [γ- 32 P]ATP and visualized by autoradiography. The relative kinase activity of CDK5/p35 was expressed as the fold change over the control (value = 1). The bar represents the mean ± S.D from 3 independent experiments. * p < 0.05. ( c ) HEK293 cells were immunostained with an anti-Ac-CDK5 antibody. Staining specificity was confirmed by pre-incubating with the blocking peptide (EIVAL(acK)RVRLD) that was used to raise the antibody. The nuclei were counterstained with Hoechst dye. Confocal microscopy images are shown. The scale bar represents 10 μm. ( d ) HEK293 cells transfected with the indicated combinations of constructs were subjected to cellular fractionation. The resulting nuclear fractions were IPed with an anti-FLAG antibody and subsequently subjected to either IB with an anti-Ac-CDK5 or anti-FLAG antibody or an in vitro phosphorylation assay in the presence of H1 and [γ- 32 P]ATP. Signals from the phosphorylated H1 were visualized by autoradiography. The fold change over the control (value = 1) is indicated. Nuclear fractions were subjected to IB with the indicated antibodies. Anti-SOD-1 and anti-lamin A/C antibodies were employed to verify the purity of the nuclear fractions.](https://pub-med-central-images-cdn.bioz.com/pub_med_central_ids_ending_with_5752/pmc06135752/pmc06135752__41598_2018_31785_Fig2_HTML.jpg)
Journal: Scientific Reports
Article Title: The acetylation of cyclin-dependent kinase 5 at lysine 33 regulates kinase activity and neurite length in hippocampal neurons
doi: 10.1038/s41598-018-31785-9
Figure Lengend Snippet: GCN5 acetylates CDK5 at K33 in the nucleus. ( a ) Lysates obtained from HEK293 cells expressing FLAG-CDK5 plus one of the indicated KAT vectors were subjected to IP with an anti-FLAG antibody followed by IB with an anti-Ac-CDK5 antibody or anti-FLAG antibody. The intensity of the Ac-CDK5 band was measured using Image-J software and normalized to FLAG-CDK5. The fold change over the control (value = 1) is indicated at the bottom of the blot. WCLs were subjected to IB analysis with the indicated antibodies. Each KAT band is marked by the indicated letters. The asterisk indicates non-specific bands. After normalization to FLAG-CDK5, the fold intensity of Ac-CDK5 versus the control (value = 1) was indicated. The bar represents the mean ± S.D from three independent experiments. *** p < 0.001; * p < 0.05; n.s, not significant. ( b ) Lysates harvested from HEK293 cells expressing FLAG-CDK5 alone or in combination with p35-MYC and/or FLAG-GCN5 were subjected to IP with an anti-FLAG antibody. The bound CDK5 was incubated in the presence of H1 and [γ- 32 P]ATP and visualized by autoradiography. The relative kinase activity of CDK5/p35 was expressed as the fold change over the control (value = 1). The bar represents the mean ± S.D from 3 independent experiments. * p < 0.05. ( c ) HEK293 cells were immunostained with an anti-Ac-CDK5 antibody. Staining specificity was confirmed by pre-incubating with the blocking peptide (EIVAL(acK)RVRLD) that was used to raise the antibody. The nuclei were counterstained with Hoechst dye. Confocal microscopy images are shown. The scale bar represents 10 μm. ( d ) HEK293 cells transfected with the indicated combinations of constructs were subjected to cellular fractionation. The resulting nuclear fractions were IPed with an anti-FLAG antibody and subsequently subjected to either IB with an anti-Ac-CDK5 or anti-FLAG antibody or an in vitro phosphorylation assay in the presence of H1 and [γ- 32 P]ATP. Signals from the phosphorylated H1 were visualized by autoradiography. The fold change over the control (value = 1) is indicated. Nuclear fractions were subjected to IB with the indicated antibodies. Anti-SOD-1 and anti-lamin A/C antibodies were employed to verify the purity of the nuclear fractions.
Article Snippet: To assess ATP binding affinity, purified recombinant His-CDK5 WT and His-Ac-CDK5 (1 μg) were reacted for 2 hrs with 20 μl of
Techniques: Expressing, Software, Incubation, Autoradiography, Activity Assay, Staining, Blocking Assay, Confocal Microscopy, Transfection, Construct, Cell Fractionation, In Vitro, Phosphorylation Assay

Journal: Scientific Reports
Article Title: The acetylation of cyclin-dependent kinase 5 at lysine 33 regulates kinase activity and neurite length in hippocampal neurons
doi: 10.1038/s41598-018-31785-9
Figure Lengend Snippet: SIRT1 is responsible for the deacetylation of Ac-CDK5. ( a ) HEK293 cells transiently expressing FLAG-CDK5 were treated for 24 hrs with increasing doses of nicotinamide (NA, a pan-SIRT inhibitor). Lysates were subjected to IP with an anti-FLAG antibody and probed with the indicated antibodies. After normalization to FLAG-CDK5, the fold intensity of Ac-CDK5 versus control (value = 1) was determined. ( b ) HEK293 cells were transfected with one of the FLAG-tagged SIRTs plus FLAG-CDK5 and GCN5-HA. Lysates were subjected to IP with an anti-FLAG antibody and IB with an anti-Ac-CDK5 antibody. WCLs were subjected to IB with the indicated antibodies. Each band of SIRTs is marked by the indicated letters. After normalization to FLAG-CDK5, the fold intensity of Ac-CDK5 versus the control (value = 1) was indicated. The bar represents the mean ± S.D from three independent experiments. *** p < 0.001; n.s, not significant. ( c ) FLAG-SIRT1 was expressed in HEK293 cells and purified by IP with FLAG beads. SIRT1-bound beads were incubated with recombinant His-Ac-CDK5 supplemented with β-nicotinamide adenine dinucleotide (NAD + ) to activate SIRT1. Reaction mixtures were subjected to IB with an anti-Ac-CDK5 antibody. The fold intensity of Ac-CDK5 versus the control (value = 1) was determined after normalization to the His-Ac-CDK5 inputs. The inputs were probed with the indicated antibodies. ( d , e ) HEK293 cells transfected with FLAG-CDK5 were treated with increasing doses of ( d ) EX527 (a selective SIRT1 inhibitor) or ( e ) SRT1720 (a selective SIRT1 activator) for 24 hrs. Lysates were subjected to IP with an anti-FLAG antibody followed by IB with an anti-Ac-CDK5 antibody. After normalization to FLAG-CDK5, the fold change over the control (value = 1) was determined. ( f ) Lysates were prepared from HEK293 cells transfected with FLAG-CDK5 and p35-HA and exposed to 100 μM EX527 for 24 hrs. Immunoprecipitates purified with an anti-FLAG antibody were subjected either to IB with the indicated antibodies or an in vitro phosphorylation assay in the presence of H1 and cold ATP. Phospho-H1 signals were visualized with an anti-phospho-H1 antibody. After normalization to FLAG-CDK5, the fold intensity of Ac-CDK5 versus the control (value = 1) was indicated. The bar represents the mean ± S.D from three independent experiments. * p < 0.05.
Article Snippet: To assess ATP binding affinity, purified recombinant His-CDK5 WT and His-Ac-CDK5 (1 μg) were reacted for 2 hrs with 20 μl of
Techniques: Expressing, Transfection, Purification, Incubation, Recombinant, In Vitro, Phosphorylation Assay
![Pharmacological modulation of SIRT1 affects Ac-CDK5 levels and kinase activity in hippocampal neurons. ( a ) Primary cultures of hippocampal neurons were prepared from rat hippocampi isolated in gestational day 18. At the indicated days in vitro (DIV), photomicrographs were captured with an Axiovert 100. The scale bar represents 50 μm. ( b ) Cultured hippocampal neurons at DIV5 were fixed and immunostained with an anti-Ac-CDK5 antibody and an anti-NeuN antibody (a neuronal nuclear marker) followed by incubation with appropriate fluorescence-tagged secondary antibodies. Fluorescent images were obtained with an LSM700 confocal microscope. The scale bar represents 10 μm. ( c ) Hippocampal neurons at DIV3 were treated with SRT1720 or EX527 at the indicated doses for 48 hrs. Immunoprecipitates of cellular lysates purified with an anti-CDK5 antibody or IgG were subjected to IB with an anti-CDK5 antibody or an in vitro phosphorylation assay in the presence of H1 and [γ- 32 P]ATP. Phosphorylated H1 signals were visualized by autoradiography. After normalization to H1 or CDK5, the relative intensities of phospho-H1 and Ac-CDK5 were calculated over the controls (value = 1) and are indicated at the bottom of the blot. WCLs were subjected to IB with the indicated antibodies. ( d , e ) The relative kinase activity of CDK5 was expressed as the fold change over the control (value = 1) in the presence of ( d ) SRT1720 or ( e ) EX527. The bar represents the mean ± S.D from 4 independent experiments. *** p < 0.001. ( f ) Hippocampal neurons at DIV3 were treated with EX527 at 100 μM for 48 hrs, fixed, and then processed for immunofluorescent staining as described in ( b ). The scale bar represents 50 μm. ( g ) The fluorescence intensity of Ac-CDK5 in the nuclei of NeuN-positive neurons was measured using Image-J software. The relative fluorescence intensity was expressed as the fold change over the control (value = 1). The bars represent the mean ± S.D of 35 neurons from at least 5 randomly selected areas. *** p < 0.001.](https://pub-med-central-images-cdn.bioz.com/pub_med_central_ids_ending_with_5752/pmc06135752/pmc06135752__41598_2018_31785_Fig5_HTML.jpg)
Journal: Scientific Reports
Article Title: The acetylation of cyclin-dependent kinase 5 at lysine 33 regulates kinase activity and neurite length in hippocampal neurons
doi: 10.1038/s41598-018-31785-9
Figure Lengend Snippet: Pharmacological modulation of SIRT1 affects Ac-CDK5 levels and kinase activity in hippocampal neurons. ( a ) Primary cultures of hippocampal neurons were prepared from rat hippocampi isolated in gestational day 18. At the indicated days in vitro (DIV), photomicrographs were captured with an Axiovert 100. The scale bar represents 50 μm. ( b ) Cultured hippocampal neurons at DIV5 were fixed and immunostained with an anti-Ac-CDK5 antibody and an anti-NeuN antibody (a neuronal nuclear marker) followed by incubation with appropriate fluorescence-tagged secondary antibodies. Fluorescent images were obtained with an LSM700 confocal microscope. The scale bar represents 10 μm. ( c ) Hippocampal neurons at DIV3 were treated with SRT1720 or EX527 at the indicated doses for 48 hrs. Immunoprecipitates of cellular lysates purified with an anti-CDK5 antibody or IgG were subjected to IB with an anti-CDK5 antibody or an in vitro phosphorylation assay in the presence of H1 and [γ- 32 P]ATP. Phosphorylated H1 signals were visualized by autoradiography. After normalization to H1 or CDK5, the relative intensities of phospho-H1 and Ac-CDK5 were calculated over the controls (value = 1) and are indicated at the bottom of the blot. WCLs were subjected to IB with the indicated antibodies. ( d , e ) The relative kinase activity of CDK5 was expressed as the fold change over the control (value = 1) in the presence of ( d ) SRT1720 or ( e ) EX527. The bar represents the mean ± S.D from 4 independent experiments. *** p < 0.001. ( f ) Hippocampal neurons at DIV3 were treated with EX527 at 100 μM for 48 hrs, fixed, and then processed for immunofluorescent staining as described in ( b ). The scale bar represents 50 μm. ( g ) The fluorescence intensity of Ac-CDK5 in the nuclei of NeuN-positive neurons was measured using Image-J software. The relative fluorescence intensity was expressed as the fold change over the control (value = 1). The bars represent the mean ± S.D of 35 neurons from at least 5 randomly selected areas. *** p < 0.001.
Article Snippet: To assess ATP binding affinity, purified recombinant His-CDK5 WT and His-Ac-CDK5 (1 μg) were reacted for 2 hrs with 20 μl of
Techniques: Activity Assay, Isolation, In Vitro, Cell Culture, Marker, Incubation, Fluorescence, Microscopy, Purification, Phosphorylation Assay, Autoradiography, Staining, Software
Journal: eLife
Article Title: Filopodia powered by class x myosin promote fusion of mammalian myoblasts
doi: 10.7554/eLife.72419
Figure Lengend Snippet: ( A ) Myo10 protein content increases during myoblast differentiation, as measured by immunoblotting (n = 3 individual experiments). ( B ) Fractionation of differentiation day 5 myoblast cultures into soluble and insoluble cellular fractions reveals that the slight majority of Myo10 content exists in the soluble fraction. ( C ) Immunofluorescence (IF) of differentiated myoblast insoluble fractions shows that Myo10 of the insoluble cellular fraction is associated with the actin cytoskeleton (as shown by phalloidin staining) and can be found at the tips of thin cellular projections. ( D ) Schematic of the consensus E-box-binding motifs (CANNTG) identified in the Myo10 promoter. ( E–F ) Activation of the Myo10 promoter reporter plasmid in differentiating myoblasts co-transfected with constitutively expressed GFP-CAAX and mApple (RFP) driven by the Myo10 promoter depicted in ( D ) (n = 4 individual experiments). ( G ) Expression of RFP in a differentiating myoblast following 1 day of differentiation. Efficient shRNA-mediated knockdown (KD) of myoblast Myo10 gene expression in ( H ) undifferentiated and ( I ) differentiated myoblasts, whereas muscle differentiation is not affected by Myo10 KD, as indicated by Myh2 expression, a gene encoding a mature myosin heavy chain (MHC) expressed by skeletal muscle (n = 3 individual experiments). ( J ) Representative images of MHC IF of control shRNA cells, Myo10 KD cells expressing a control RFP plasmid after 7 days of differentiation, and Myo10 KD cells expressing an RFP-Myo10 rescue plasmid. Data are presented as box-and-whisker plots depicting second and third quartiles with minimum and maximum values. Data of ( A ) were analyzed using one-way ANOVA followed by Tukey post hoc tests (α = 0.05; *p < 0.05 vs. day 1 values; # p < 0.05 vs. day 3 values; effect size is presented as eta-squared (η 2 )). Data of ( E ) and ( H–I ) were analyzed using two-tailed Welch’s t-tests with effect size presented as Cohen’s d ( d ). Scale bars represent ( G ) 10 or ( C, J ) 25 µm. Figure 2—figure supplement 1—source data 1. Source data file for . Figure 2—figure supplement 1—source data 2. Source data file for . Figure 2—figure supplement 1—source data 3. Source data file for . Figure 2—figure supplement 1—source data 4. Source data file for . Figure 2—figure supplement 1—source data 5. Source data file for . Figure 2—figure supplement 1—source data 6. Source data file for .
Article Snippet: The RFP-Myo10 construct was prepared by cloning mApple (from Addgene No. 54631) to the N-terminus of human Myo10 (NCBI Accession No. NP_036466) using a G-G-R linker, similar to as previously described , in pCDNA3.1(+) vector (Thermofisher No. V79020).
Techniques: Western Blot, Fractionation, Immunofluorescence, Staining, Binding Assay, Activation Assay, Plasmid Preparation, Transfection, Expressing, shRNA, Knockdown, Gene Expression, Control, Whisker Assay, Two Tailed Test

Journal: eLife
Article Title: Filopodia powered by class x myosin promote fusion of mammalian myoblasts
doi: 10.7554/eLife.72419
Figure Lengend Snippet: Clonal lines of C2C12 cells expressing control or Myo10 -targeted short-hairpin RNA (shRNA) were validated for efficacy of Myo10 knockdown (KD) and myogenic differentiation potential. ( A ) Immunoblotting for Myo10 protein and the myogenic differentiation marker, myosin heavy chain (MHC; loading control visualized by Ponceau Red staining). KD of Myo10 myoblasts results in loss of filopodia during differentiation compared to control shRNA cells, as demonstrated by ( B ) immunofluorescence (day 3), ( C ) scanning electron microscopy (day 5), and ( D ) live-cell confocal microscopy (day 5), as well as loss of ( E ) cellular extension lengths (n = 31–152 cellular extensions). Myoblast differentiation assays (n = 3 individual experiments) reveal loss of multinucleated myotubes formation in Myo10 KD cells after 7 days of differentiation compared to control cells, quantified as ( F ) population distribution of myotube nuclear content. ( G–H ) Loss of fusion ability by Myo10 KD cells can be partially rescued by transfection of a full-length Myo10 construct with an N-terminal mApple fluorescent tag (RFP-Myo10; n = 3–6 individual experiments). Data analysis performed using ( E–F ) Welch’s two-tailed t-test (α = 0.05) with effect size displayed as Cohen’s d ( d ) or ( H ) one-way ANOVA followed by Tukey post hoc tests (α = 0.05; *p < 0.05 vs. control values; # p < 0.05 vs. RFP values; effect size is presented as eta-squared (η 2 )). Unless otherwise noted, scale bars represent 25 µm. Figure 3—source data 1. Source data file for . Figure 3—source data 2. Source data file for . Figure 3—source data 3. Source data file for . Figure 3—source data 4. Source data file for .
Article Snippet: The RFP-Myo10 construct was prepared by cloning mApple (from Addgene No. 54631) to the N-terminus of human Myo10 (NCBI Accession No. NP_036466) using a G-G-R linker, similar to as previously described , in pCDNA3.1(+) vector (Thermofisher No. V79020).
Techniques: Expressing, Control, shRNA, Knockdown, Western Blot, Marker, Staining, Immunofluorescence, Electron Microscopy, Confocal Microscopy, Transfection, Construct, Two Tailed Test

Journal: eLife
Article Title: Filopodia powered by class x myosin promote fusion of mammalian myoblasts
doi: 10.7554/eLife.72419
Figure Lengend Snippet:
Article Snippet: The RFP-Myo10 construct was prepared by cloning mApple (from Addgene No. 54631) to the N-terminus of human Myo10 (NCBI Accession No. NP_036466) using a G-G-R linker, similar to as previously described , in pCDNA3.1(+) vector (Thermofisher No. V79020).
Techniques: Transfection, Construct, Membrane, Activation Assay, Control, shRNA, Sequencing
Journal: bioRxiv
Article Title: DENND6A couples Arl8b to a Rab34/RILP/dynein complex regulating retrograde lysosomal trafficking and autophagy
doi: 10.1101/2023.08.21.554162
Figure Lengend Snippet: (A) BioID interactome of DENND6A, taken from human cell map. (B) HeLa cells expressing either GFP alone or DENND6A-GFP were fixed, stained with LAMP1 antibody and imaged using confocal microscopy (Leica SP8). The cell periphery is outlined by a white dotted line. Scale bar = 10 µm for low magnification images; 2.8 µm for high magnification images corresponding to inset 1 and ‘a’; and 2.2 µm for high magnification images corresponding to inset 2 and ‘b’. 3D structures of inset 1 and ‘a’ or 2 and ‘b’ corresponding to GFP or DENND6A-GFP expressing cells were generated using Imaris. Yellow arrow indicates colocalization between DENND6A-GFP and LAMP1. (C) Graphical representation of the Pearson correlation coefficient for the co-localization of GFP or DENND6A-GFP with LAMP1 from experiments performed in B ; means ± SEM; Mann-Whitney U test (**** P ≤ 0.0001; n (GFP; DENND6A-GFP) = 25). (D) HeLa cells expressing either GFP alone or DENND6A-GFP were fixed, stained with LAMP1 antibody. 3D-SIM images were acquired using LSM880-Elyra PS1 super-resolution microscopy. The cell periphery is outlined by a white dotted line. Scale bar = 10 µm for low magnification images; 4.18 µm and 4.14 µm for high magnification images corresponding to insets from GFP or DENND6A-GFP expressing cells. (E) 3D reconstruction of SIM imaging performed in D . Scale bar = 10 µm for low magnification images; 3 µm for high magnification images. (F) Lysates from HEK-293 cells expressing the Tmem192-3xHA (HA-Lyso cells) or the Tmem192-2xFlag (Control-Lyso cells) were prepared as per the protocol. Lysosomes were immunoprecipitated using anti-HA magnetic beads and analyzed by immunoblot. SM stands for starting material and IP stands for immunoprecipitation. Red arrow indicates specific band corresponding to TMEM192-FLAG.
Article Snippet: The following constructs were custom synthesized by SynBio technologies:
Techniques: Expressing, Staining, Confocal Microscopy, Generated, MANN-WHITNEY, Microscopy, Imaging, Immunoprecipitation, Magnetic Beads, Western Blot

Journal: bioRxiv
Article Title: DENND6A couples Arl8b to a Rab34/RILP/dynein complex regulating retrograde lysosomal trafficking and autophagy
doi: 10.1101/2023.08.21.554162
Figure Lengend Snippet: (A) Schematic representation of the quantification of cumulative intensity distribution method for lysosomal distribution. (B) Unstarved HeLa cells expressing either GFP alone or DENND6A-GFP were fixed, stained with LAMP1 antibody and imaged using confocal microscopy (Leica SP8). The cell periphery is outlined by a white dotted line. Scale bar = 10 µm for low magnification images; 3.4 µm and 2.1 µm for high magnification images corresponding to inset 1 and 2. (C) Graphical representation of cumulative distribution of LAMP1 intensity in experiments performed in B ; mean ± SEM; extra sum of F-squares test following nonlinear regression and curve fitting; n = 30 cells from 3 replicates. (D) Immunoblot showing the protein levels in WT and DENND6A KO HeLa cells. Immunoblot probed with anti-DENND6A and anti-GAPDH antibodies. (E) WT and DENND6A KO unstarved HeLa cells were fixed, stained with LAMP1 antibody and DAPI, and imaged using confocal microscopy (Leica SP8). The cell periphery is outlined by a white dotted line. Scale bar = 10 µm. Yellow arrow indicates peripheral lysosomes. (F) Graphical representation of cumulative distribution of LAMP1 intensity in experiments performed in E ; mean ± SEM; extra sum of F-squares test following nonlinear regression and curve fitting; n = 30 cells from 3 replicates.
Article Snippet: The following constructs were custom synthesized by SynBio technologies:
Techniques: Expressing, Staining, Confocal Microscopy, Western Blot
![(A) Schematic representation of rapamycin-induced relocalization of DENND6A to the peroxisome. FKBP = FK506-binding protein domain; FRB = FKBP-rapamycin–binding domain. (B-C) HeLa cells were co-transfected with (B) FRB-GFP and PEX3-FKBP-mCherry, (C) DENND6A-FRB-GFP and PEX3-FKBP-mCherry and treated with or without rapamycin for 1 h. Following rapamycin treatment, cells were fixed and imaged. The cell periphery is outlined by a white dotted line. Scale bars = 10 μm. (D-E) Graphical representation of cumulative peroxisomal distribution (mCherry intensity) in experiments performed in B and C ; mean ± SEM; extra sum of F-squares test following nonlinear regression and curve fitting; n [(GFP-FRB + Rapamycin), (GFP-FRB - Rapamycin), (DENND6A-GFP-FRB + Rapamycin), (DENND6A-GFP-FRB - Rapamycin)] = (31, 30, 30, 29) cells from 3 replicates.](https://bio-rxiv-images-cdn.bioz.com/dois_ending_with_62/10__1101_slash_2023__08__21__554162/10__1101_slash_2023__08__21__554162___F3.large.jpg)
Journal: bioRxiv
Article Title: DENND6A couples Arl8b to a Rab34/RILP/dynein complex regulating retrograde lysosomal trafficking and autophagy
doi: 10.1101/2023.08.21.554162
Figure Lengend Snippet: (A) Schematic representation of rapamycin-induced relocalization of DENND6A to the peroxisome. FKBP = FK506-binding protein domain; FRB = FKBP-rapamycin–binding domain. (B-C) HeLa cells were co-transfected with (B) FRB-GFP and PEX3-FKBP-mCherry, (C) DENND6A-FRB-GFP and PEX3-FKBP-mCherry and treated with or without rapamycin for 1 h. Following rapamycin treatment, cells were fixed and imaged. The cell periphery is outlined by a white dotted line. Scale bars = 10 μm. (D-E) Graphical representation of cumulative peroxisomal distribution (mCherry intensity) in experiments performed in B and C ; mean ± SEM; extra sum of F-squares test following nonlinear regression and curve fitting; n [(GFP-FRB + Rapamycin), (GFP-FRB - Rapamycin), (DENND6A-GFP-FRB + Rapamycin), (DENND6A-GFP-FRB - Rapamycin)] = (31, 30, 30, 29) cells from 3 replicates.
Article Snippet: The following constructs were custom synthesized by SynBio technologies:
Techniques: Binding Assay, Transfection

Journal: bioRxiv
Article Title: DENND6A couples Arl8b to a Rab34/RILP/dynein complex regulating retrograde lysosomal trafficking and autophagy
doi: 10.1101/2023.08.21.554162
Figure Lengend Snippet: (A) Schematic model of the cell-based assay. (B) List of Rabs recruited by DENND6A at the mitochondria. (C) HeLa cells co-transfected with GFP-Rabs and mito-mSc-DENND6A were fixed and imaged. The nucleus and cell periphery are outlined by blue and white dotted line respectively. Scale bar = 10 µm.
Article Snippet: The following constructs were custom synthesized by SynBio technologies:
Techniques: Cell Based Assay, Transfection
![(A) Purified GST, GST-Rab34 QL and GST-Rab34 TN were incubated with lysates from HEK-293T cells expressing DENND6A-GFP. Specifically bound proteins were detected by immunoblot with anti-GFP antibody. The starting material (SM) was run in parallel to detect the total DENND6A-GFP. (B) Quantification of experiment in A ; means ± SEM; two-tailed unpaired t test (*** P ≤ 0.0005; n = 3). (C) GFP or DENND6A-GFP expressing HEK-293T cell lysates were incubated with purified T7-RILP protein. Specifically bound proteins were detected by immunoblot with anti-Rab34 antibody. The starting material (SM) was run in parallel to detect the total Rab34. Anti-GFP was used to detect GFP or DENND6A-GFP proteins and anti-HSC70 antibody was used as a loading control. (D) Quantification of experiment in C ; means ± SEM; two-tailed unpaired t test (** P ≤ 0.0025; n = 3). (E) In vitro GEF assays using purified Rab34 with or without DENND6A as indicated. The amount of [ 35 S]GTPγS transferred to the Rab34 was determined by collecting the reactions on filters, followed by scintillation counting. The relative incorporation of [ 35 S]GTPγS is plotted over time; data represent mean ± SEM; n = 3. The curve was fitted by nonlinear regression one-phase association. (F) HeLa cells co-expressing DENND6A-GFP and mCherry-Rab34 were fixed and stained with LAMP1 antibody. The cell periphery is outlined by a white dotted line. Scale bar = 10 µm for low magnification images; 3.13 µm for high magnification images. (G) HeLa cells treated with control or Rab34 siRNA were transfected with DENND6A-GFP. 16 h post transfection, cells were fixed and stained with LAMP1 antibody. The cell periphery is outlined by a white dotted line. Scale bar = 10 µm. (H) Graphical representation of cumulative distribution of LAMP1 intensity in experiments performed in G ; mean ± SEM; extra sum of F-squares test following nonlinear regression and curve fitting; n= 30 cells from 3 replicates. (I) Immunoblot showing the Rab34 protein levels in control and Rab34 siRNA treated HeLa cells. Immunoblot probed with anti-Rab34 and anti-GAPDH antibodies. (J) WT and DENND6A KO HeLa cells were transfected with GFP-Rab34. 16 h post transfection, cells were fixed and stained with LAMP1 antibody. The cell periphery is outlined by a white dotted line. Scale bar = 10 µm. (K) Graphical representation of cumulative distribution of LAMP1 intensity in experiments performed in J ; mean ± SEM; extra sum of F-squares test following nonlinear regression and curve fitting; n= 36 and 34 cells from 3 replicates corresponding to WT and DENND6A KO cells.](https://bio-rxiv-images-cdn.bioz.com/dois_ending_with_62/10__1101_slash_2023__08__21__554162/10__1101_slash_2023__08__21__554162___F5.large.jpg)
Journal: bioRxiv
Article Title: DENND6A couples Arl8b to a Rab34/RILP/dynein complex regulating retrograde lysosomal trafficking and autophagy
doi: 10.1101/2023.08.21.554162
Figure Lengend Snippet: (A) Purified GST, GST-Rab34 QL and GST-Rab34 TN were incubated with lysates from HEK-293T cells expressing DENND6A-GFP. Specifically bound proteins were detected by immunoblot with anti-GFP antibody. The starting material (SM) was run in parallel to detect the total DENND6A-GFP. (B) Quantification of experiment in A ; means ± SEM; two-tailed unpaired t test (*** P ≤ 0.0005; n = 3). (C) GFP or DENND6A-GFP expressing HEK-293T cell lysates were incubated with purified T7-RILP protein. Specifically bound proteins were detected by immunoblot with anti-Rab34 antibody. The starting material (SM) was run in parallel to detect the total Rab34. Anti-GFP was used to detect GFP or DENND6A-GFP proteins and anti-HSC70 antibody was used as a loading control. (D) Quantification of experiment in C ; means ± SEM; two-tailed unpaired t test (** P ≤ 0.0025; n = 3). (E) In vitro GEF assays using purified Rab34 with or without DENND6A as indicated. The amount of [ 35 S]GTPγS transferred to the Rab34 was determined by collecting the reactions on filters, followed by scintillation counting. The relative incorporation of [ 35 S]GTPγS is plotted over time; data represent mean ± SEM; n = 3. The curve was fitted by nonlinear regression one-phase association. (F) HeLa cells co-expressing DENND6A-GFP and mCherry-Rab34 were fixed and stained with LAMP1 antibody. The cell periphery is outlined by a white dotted line. Scale bar = 10 µm for low magnification images; 3.13 µm for high magnification images. (G) HeLa cells treated with control or Rab34 siRNA were transfected with DENND6A-GFP. 16 h post transfection, cells were fixed and stained with LAMP1 antibody. The cell periphery is outlined by a white dotted line. Scale bar = 10 µm. (H) Graphical representation of cumulative distribution of LAMP1 intensity in experiments performed in G ; mean ± SEM; extra sum of F-squares test following nonlinear regression and curve fitting; n= 30 cells from 3 replicates. (I) Immunoblot showing the Rab34 protein levels in control and Rab34 siRNA treated HeLa cells. Immunoblot probed with anti-Rab34 and anti-GAPDH antibodies. (J) WT and DENND6A KO HeLa cells were transfected with GFP-Rab34. 16 h post transfection, cells were fixed and stained with LAMP1 antibody. The cell periphery is outlined by a white dotted line. Scale bar = 10 µm. (K) Graphical representation of cumulative distribution of LAMP1 intensity in experiments performed in J ; mean ± SEM; extra sum of F-squares test following nonlinear regression and curve fitting; n= 36 and 34 cells from 3 replicates corresponding to WT and DENND6A KO cells.
Article Snippet: The following constructs were custom synthesized by SynBio technologies:
Techniques: Purification, Incubation, Expressing, Western Blot, Two Tailed Test, In Vitro, Staining, Transfection

Journal: bioRxiv
Article Title: DENND6A couples Arl8b to a Rab34/RILP/dynein complex regulating retrograde lysosomal trafficking and autophagy
doi: 10.1101/2023.08.21.554162
Figure Lengend Snippet: (A) Lysates from HEK-293T cells expressing DENND6A-GFP were incubated with wither beads covalently linked to T7 antibody or T7 linked beads coupled to T7-RILP protein. Specifically bound proteins were detected by immunoblot with anti-GFP antibody, anti-dynein intermediate chain (DIC) antibody and anti-Rab34 antibody. The starting material (SM) was run in parallel to detect the total DENND6A-GFP, DIC and Rab34. (B) Immunoblot showing DIC protein levels in control and dynein siRNA treated HeLa cells. Immunoblot probed with anti-DIC and anti-HSC70 antibodies. (C) Immunoblot showing RILP protein levels in control and RILP siRNA treated HeLa cells. Immunoblot probed with anti-RILP and anti-HSC70 antibodies. (C-E) HeLa cells were treated with (C) control siRNA or (D) dynein siRNA or (E) RILP siRNA and transfected with DENND6A-GFP. 16 h post transfection, cells were fixed and stained with LAMP1 antibody. The cell periphery is outlined by a white dotted line. Scale bars = 10 μm. (F) Graphical representation of cumulative distribution of LAMP1 intensity in experiments performed in C-E ; mean ± SEM; extra sum of F-squares test following nonlinear regression and curve fitting; n = 29, 30, 30 cells from 3 replicates corresponding to control, dynein, and RILP siRNA treated cells.
Article Snippet: The following constructs were custom synthesized by SynBio technologies:
Techniques: Expressing, Incubation, Western Blot, Transfection, Staining
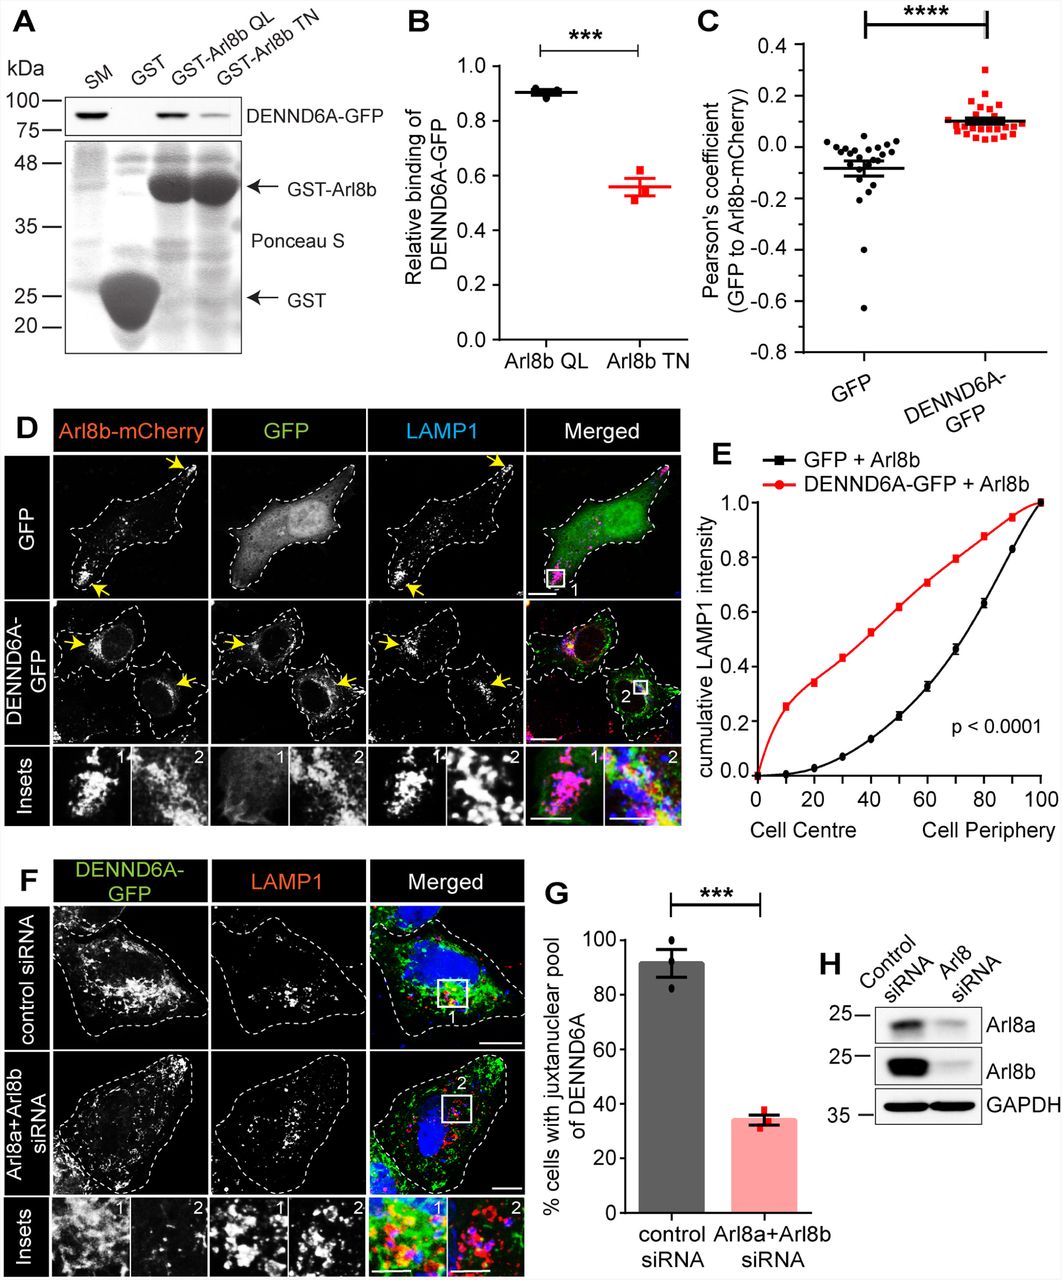
Journal: bioRxiv
Article Title: DENND6A couples Arl8b to a Rab34/RILP/dynein complex regulating retrograde lysosomal trafficking and autophagy
doi: 10.1101/2023.08.21.554162
Figure Lengend Snippet: (A) Purified GST, GST-Arl8b QL and GST-Arl8b TN were incubated with lysates from HEK-293T cells expressing DENND6A-GFP. Specifically bound proteins were detected by immunoblot with anti-GFP antibody. The starting material (SM) was run in parallel to detect the total DENND6A-GFP. (B) Quantification of experiment in A ; means ± SEM; two-tailed unpaired t test (*** P ≤ 0.0005; n = 3). (C) Graphical representation of the Pearson correlation coefficient for the co-localization of GFP or DENND6A-GFP with Arl8b-mCherry from experiments performed in D ; means ± SEM; Mann-Whitney U test (**** P ≤ 0.0001; n = 25 and 26 corresponding to GFP and DENND6A-GFP). (D) HeLa cells co-expressing either GFP alone or DENND6A-GFP along with Arl8b-mCherry were fixed, stained with LAMP1 antibody and imaged using confocal microscopy (Leica SP8). The cell periphery is outlined by a white dotted line. Scale bar = 10 µm for low magnification images; 5.22 µm and 2.12 µm for high magnification images corresponding to inset 1 and 2. (E) Graphical representation of cumulative distribution of LAMP1 intensity in experiments performed in D ; mean ± SEM; extra sum of F-squares test following nonlinear regression and curve fitting; n = 25 and 26 cells, corresponding to GFP and DENND6A-GFP. (F) Control or Arl8 siRNA treated HeLa cells were transfected with DENND6A-GFP. 16 h Post transfection, cells were fixed, stained with LAMP1 antibody and imaged using confocal microscopy (Leica SP8). The cell periphery is outlined by a white dotted line. Scale bar = 10 µm for low magnification images; 3.79 µm and 4.97 µm for high magnification images corresponding to inset 1 and 2. (G) Quantification of experiment in F ; means ± SEM; two-tailed unpaired t test (*** P = 0.0004; n = 42 and 47, corresponding to control and Arl8 siRNA). (H) Immunoblot showing Arl8a and Arl8b protein levels in control and Arl8(a+b) siRNA treated HeLa cells. Immunoblot probed with anti-Arl8a, anti-Arl8b and anti-GAPDH antibodies.
Article Snippet: The following constructs were custom synthesized by SynBio technologies:
Techniques: Purification, Incubation, Expressing, Western Blot, Two Tailed Test, MANN-WHITNEY, Staining, Confocal Microscopy, Transfection

Journal: bioRxiv
Article Title: DENND6A couples Arl8b to a Rab34/RILP/dynein complex regulating retrograde lysosomal trafficking and autophagy
doi: 10.1101/2023.08.21.554162
Figure Lengend Snippet: (A) Unstarved or Earle’s Balanced Salt Solution (EBSS) starved HeLa cells were fixed, stained with LAMP1 antibody and imaged using confocal microscopy (Leica SP8). The cell periphery is outlined by a white dotted line. Scale bar = 10 µm. Yellow arrows indicate the presence of peripheral lysosomes. (B) Graphical representation of cumulative distribution of LAMP1 intensity in experiments performed in A (under starvation condition); mean ± SEM; extra sum of F-squares test following nonlinear regression and curve fitting; n = 28, 29, 30 cells, corresponding to WT, DENND6A KO1 and DENND6A KO2. (C) Immunoblot showing LC3B-II protein levels under various conditions (unstarved; EBSS starved; and EBSS starved + Bafilomycin A1 (BafA1)) Arl8a and Arl8b protein levels in control and Arl8(a+b) siRNA treated HeLa cells. Immunoblot probed with anti-LC3B-II and anti-HSC70 antibodies. (D) Quantification of experiment in F ; means ± SEM; two-way ANOVA (** P ≤ 0.0025; *** P ≤ 0.0005; **** P ≤ 0.0001; n = 3). (E) HeLa WT and DENND6A KOs cells were fixed and stained with LC3B-II antibody and DAPI. The cell periphery is outlined by a white dotted line. Scale bar = 10 µm. (F) Quantification of experiment in E ; means ± SEM; Kruskal-Wallis test (*** P = 0.0004; n = 36, 34 and 42, corresponding to WT, DENND6A KO1 and DENND6A KO2).
Article Snippet: The following constructs were custom synthesized by SynBio technologies:
Techniques: Staining, Confocal Microscopy, Western Blot

Journal: bioRxiv
Article Title: DENND6A couples Arl8b to a Rab34/RILP/dynein complex regulating retrograde lysosomal trafficking and autophagy
doi: 10.1101/2023.08.21.554162
Figure Lengend Snippet: We propose that DENND6A functions as an effector of Arl8b. The BORC complex recruits Arl8b to peripheral lysosomes, where Arl8b in turn recruits DENND6A. Once recruited, DENND6A activates Rab34, and the activated Rab34 then recruits its own effector, RILP, which is a proposed dynein adaptor. Consequently, DENND6A links Arl8b and Rab34, facilitating retrograde lysosomal transport, from the plus to minus ends of the microtubules.
Article Snippet: The following constructs were custom synthesized by SynBio technologies:
Techniques:
Journal: bioRxiv
Article Title: Perfusion Bioreactor Culture Incorporating Mechanical Confinement Enhances Mesenchymal Stem Cell Extracellular Vesicle Production and Wound Healing Potential
doi: 10.1101/2025.08.12.669872
Figure Lengend Snippet: A) Timeline of experiment setup and injection schedule. Mice received injections of 1.1×10 10 EVs or an equivalent volume of PBS on days 0, 3, 6, and 9. B) Representative photos of splinted wounds receiving each treatment over 14 days (n=4-6). C) Percent wound closure based on wound area over 14 days (n=4-6). D) Fold change of M1 markers CD86, iNOS, and TNF11 and E) M2 markers IL-10, CD206, and Arg1 in harvested tissue from mice receiving flask and bioreactor EV injections relative to tissue from mice receiving PBS, as quantified by qPCR. Data represents 4 biological replicates analyzed with 3 technical replicates each per treatment group (n=4). F) Length of regenerating epithelium from H&E staining as a percentage of the length of the wound bed (n=4-6). G) Collagen deposition from Masson’s Trichrome staining quantified as a percentage of the total tissue volume (n=4-6). G) Granulation tissue area from H&E staining (n=4-6). I) CD31 fluorescence intensity normalized to DAPI over multiple fields of view and representative confocal microscopy images taken at 10X magnification (n=4-5). All values expressed as mean +/- standard error of the mean (ns – no significance; * p<0.05; ** p<0.01).
Article Snippet: Resulting cDNA was analyzed in a
Techniques: Injection, Staining, Fluorescence, Confocal Microscopy

Journal: bioRxiv
Article Title: Perfusion Bioreactor Culture Incorporating Mechanical Confinement Enhances Mesenchymal Stem Cell Extracellular Vesicle Production and Wound Healing Potential
doi: 10.1101/2025.08.12.669872
Figure Lengend Snippet: A) Heat map of the miRNA content of 5 µm static and 5 µm bioreactor EVs represented as the log2(fold change) relative to flask EVs (n≥2). B) Volcano plot comparing the miRNA within static and flask EVs, with the horizontal line at 1.3 (p = 0.05) representing statistical significance (n≥2). C) Volcano plot comparing the miRNA within bioreactor and flask EVs, with the horizontal line at 1.3 (p = 0.05) representing statistical significance. The labeled points indicate those in common between both static and bioreactor EVs (n≥2). All data represents the average of at least 2 independent experiments.
Article Snippet: Resulting cDNA was analyzed in a
Techniques: Labeling